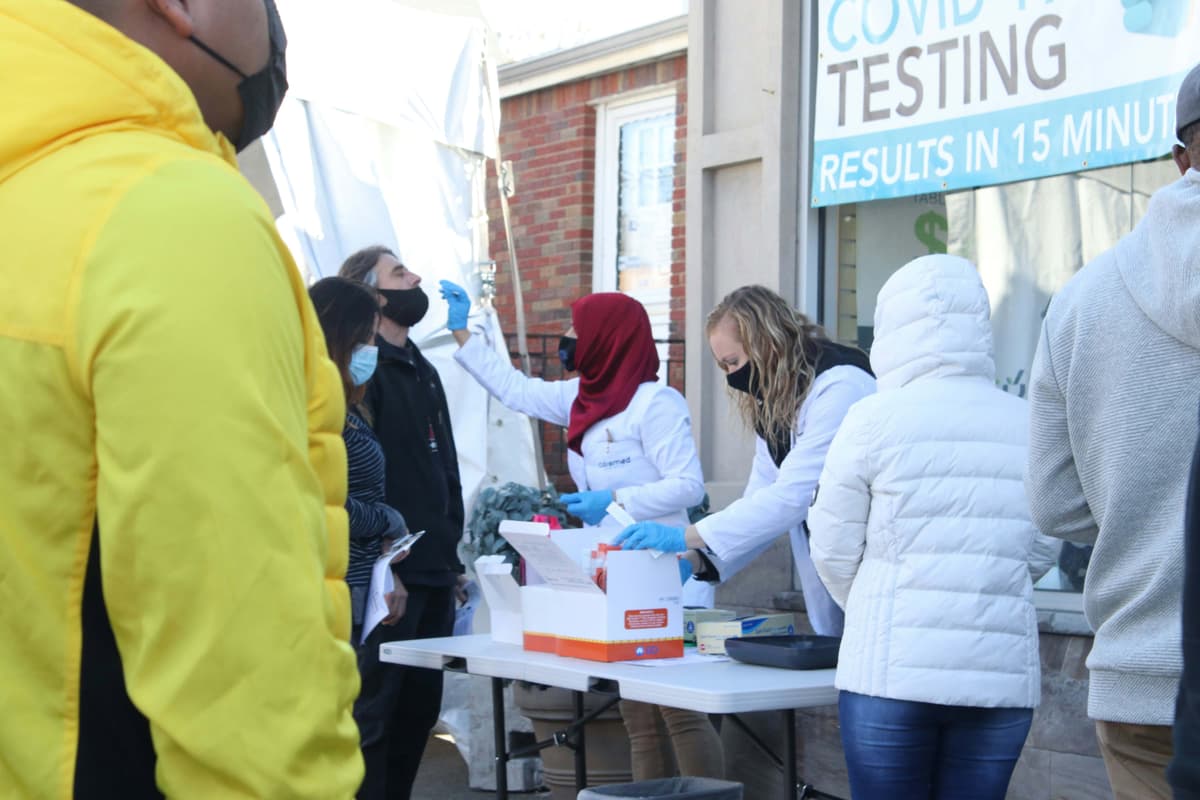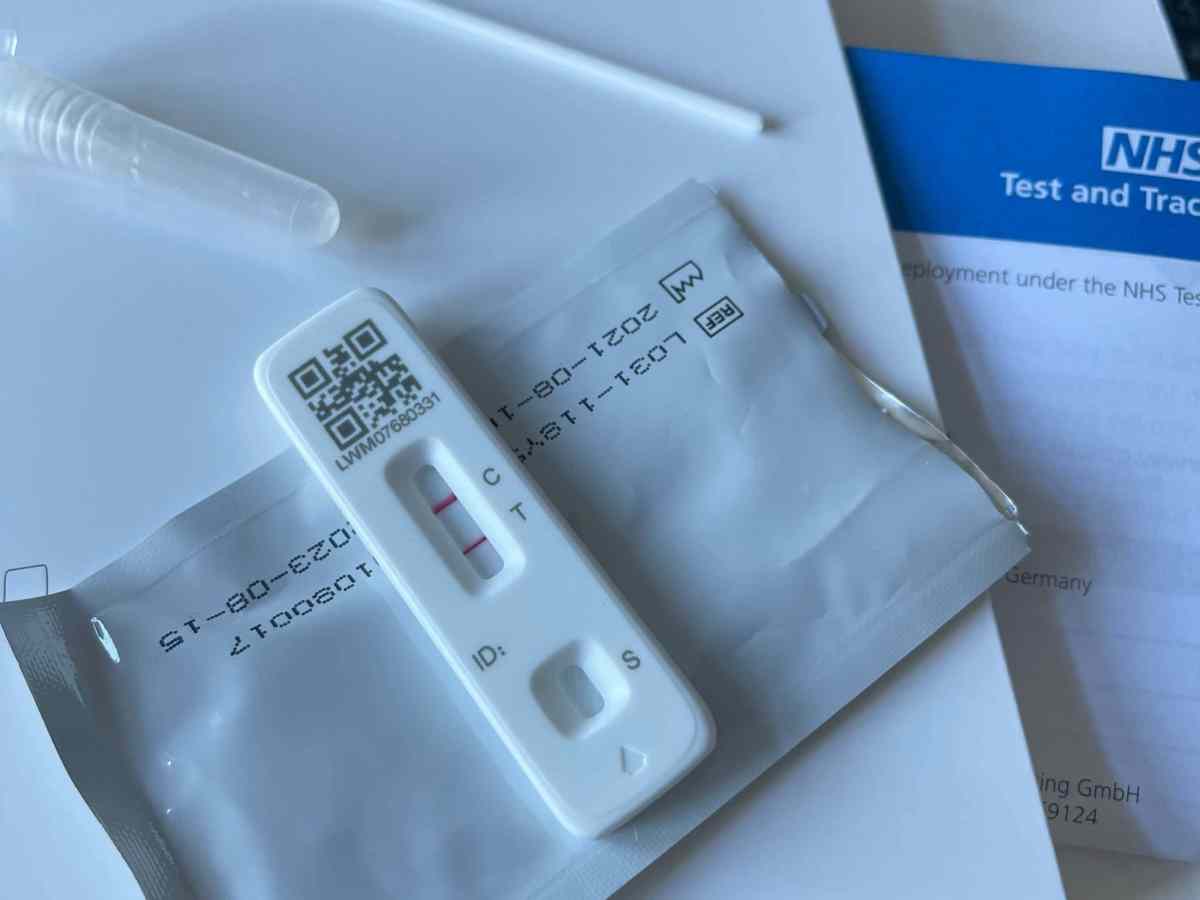
The COVID-19 Diagnostic Laboratory Testing (PCR Testing) Time Series from the U.S. Department of Health and Human Services collected a table comparing each U.S. state’s Covid tests with positivity rates and number of tests per population. The results are taken from over 1,000 U.S. laboratories and testing locations, including commercial and reference laboratories, public health laboratories, and hospital laboratories. The data set includes United States territories in addition to the 50 U.S. states.
Location | SMHA Expenditures Per Capita | Footnotes |
|---|---|---|
United States | $119.62 | |
Alabama | $72.64 | |
Alaska | $341.08 | |
Arizona | $205.23 | |
Arkansas | $45.56 | 1 |
California | $160.50 | 2 |
Colorado | $98.80 | 1, 2 |
Connecticut | $216.76 | 1, 3 |
Delaware | $96.53 | 3 |
District of Columbia | $306.87 | |
Florida | NR | |
Georgia | $59.33 | 2 |
Hawaii | $131.77 | |
Idaho | $32.77 | |
Illinois | $72.44 | |
Indiana | $70.67 | |
Iowa | $142.38 | |
Kansas | $125.47 | |
Kentucky | $55.06 | |
Louisiana | $55.50 | |
Maine | $345.36 | 2 |
Maryland | $178.82 | 2 |
Massachusetts | $110.33 | 1 |
Michigan | $130.10 | |
Minnesota | $177.88 | |
Mississippi | $55.95 | 1 |
Missouri | $99.40 | |
Montana | $208.32 | |
Nebraska | $89.75 | |
Nevada | $89.41 | |
New Hampshire | $138.40 | |
New Jersey | $208.90 | |
New Mexico | NR | |
New York | $260.78 | 2 |
North Carolina | $97.08 | |
North Dakota | $88.53 | |
Ohio | $100.29 | 1 |
Oklahoma | $53.01 | |
Oregon | $183.80 | |
Pennsylvania | $287.17 | 1 |
Rhode Island | $106.11 | |
South Carolina | $58.35 | |
South Dakota | $84.13 | |
Tennessee | $87.48 | |
Texas | $40.65 | 2 |
Utah | $70.86 | 2 |
Vermont | $291.70 | |
Virginia | $92.58 | 2 |
Washington | $113.67 | |
West Virginia | $94.44 | 1 |
Wisconsin | $113.05 | 2 |
Wyoming | $118.80 | 1 |
Puerto Rico | $19.02 | 1 |
Footnote 1. Medicaid Revenues for Community Programs are not included in SMHA-Controlled Expenditures. | ||
Footnote 2. SMHA-Controlled Expenditures include funds for mental health services in jails or prisons. | ||
Footnote 3. Children's Mental Health Expenditures are not included in SMHA-Controlled Expenditures. | ||

California
New York
Florida
Texas
Illinois
From this list of states and territories we see that all five have a significantly large population. The National Institutes of Health explain that given that the virus is infectious—more infectious than the seasonal flu—the rate of reproduction is likely higher in large urban areas due to greater opportunities afforded by denser populations. Therefore, states with larger populations are more susceptible to the virus, its symptoms, and its fatal outcomes.
District of Columbia
Vermont
Illinois
California
New York
This column is similar to the previous column as they both compare COVID tests with the state’s population; however, while the last column’s results fell to how large the total population of the state was, this column takes that factor out of the picture.
This column lists the number of COVID-19 tests conducted each day, adjusted to a population size of one million people. This metric allows for a standardized comparison of testing rates across states with different population sizes.
We find that three states repeat from the first list: Illinois, California, and New York. However, the top two on this list—the District of Columbia and Vermont—have relatively small populations. In fact, Vermont is ranked 49th out of the 50 states in terms of population. The District of Columbia’s population is comparable to that of the smallest states, like Vermont or Wyoming, with 671,803 as of 2022 compared to Vermont’s 647,064.
ABC news in 2020 described Vermont as a “model for the country” in responding to the coronavirus pandemic. Vermont has a small, closely-knit population, which allowed the state to implement targeted testing strategies effectively. Dr. Mark Levine, the state’s health commissioner, explained how early in the pandemic, the state knew that it “needed to actively and proactively protect the most vulnerable.” Specifically, the state focused on testing efforts in long-term care facilities and offered universal testing at group-living facilities.
Similarly, in the District of Columbia, the local government, led by Mayor Muriel Bowser, established numerous testing sites across the city, making it easy for residents to access testing. The District also implemented programs like “Test Yourself DC,” which allowed residents to pick up at-home testing kits from various locations, further increasing testing accessibility. Additionally, D.C. expanded its testing efforts for essential workers and in public schools, contributing to a higher number of tests conducted.
While the largest cities tend to have a greater amount of COVID tests as a result of higher infectious opportunities afforded by their denser populations, some smaller cities have a high number of COVID tests due to their proactive and widespread testing programs.
The bottom five states by daily tests per population are:
Tennessee
Iowa
Nebraska
Missouri
Washington
The range of the population sizes of these states are from 7.9 million people (Washington) to 2 million people (Nebraska). For context, California’s population size as the largest state is 39 million, while Wyoming, the smallest state, has a population size of 584,057. The five states in this list are closer to the middle, taking away the factors a large or small population size have on testing as mentioned above.
Furthermore, lower population density in rural areas might lead to fewer perceived needs for testing. In states like Nebraska or Iowa, where large portions of the population live in rural settings, the spread of the virus might have been slower, leading to lower demand for testing. In addition, if people have to travel long distances to get tested, they might be less likely to do so frequently.

Positivity rate is defined as the percentage of COVID-19 tests that come back positive among all tests conducted in a given time period.
The five states with the highest positivity rates in the table are:
Iowa
Tennessee
New Mexico
West Virginia
Mississippi
Some factors that affect positivity rates are high transmission rates, limited testing, testing strategy, delayed testing, public health measures, and population density and mobility.
A low positivity rate means that a smaller percentage of the tests conducted are returning positive results, indicating a lower level of COVID-19 transmission within the community. This generally suggests that the virus is less prevalent and that the spread is being controlled more effectively.
The five areas with the lowest positivity rates are:
District of Columbia
Massachusetts
Illinois
Maryland
New York
Actions that can decrease positivity rates are widespread testing, effective public health measures, vaccination, and monitoring and adaptation.
Many of these areas—the District of Columbia, Illinois, and New York—have conducted a large number of COVID-19 tests. Ensuring broad access to testing for symptomatic individuals, close contacts, and even asymptomatic people in high-risk settings helped identify and isolate cases early.
COVID-19 tests play a crucial role in managing the pandemic and understanding the spread of the virus. While generally, large and small states tended to conduct a higher amount of tests and thus have a lower positivity rate, there isn’t a clear trend that connects population to the spread of the virus, or the correlation of the number of tests to positivity rates.

Pilates is focused on enhancing core strength, crucial for overall torso stability and fluid movement. The core, influencing both legs and upper body, is essential for everyday comfort, such as sitting and standing without pain. The aim is to move gracefully through balanced muscle development, addressing potential weaknesses and promoting full joint mobility. The workout …

Rocky Mountain spotted fever (RMSF) is a bacterial infection caused by Rickettsia rickettsii and transmitted through the bite of an infected tick. This infection is characterized by the sudden onset of fever, headache, and rash, which can be life-threatening if not treated promptly. This infection was first identified in 1896 in the Snake River Valley …

COVID-19 has faded from the public conversation, but it is still as prevalent as ever, with wastewater levels in 2024 approaching those seen at the beginning of the pandemic in 2020. Furthermore, as COVID-19 has become less of a hot topic, many of the resources that made COVID-19 vaccines free or cheap have dried up …