In the United States, inequality manifests in various forms, from access to education and health insurance to incarceration and homelessness. This article presents 20 crucial facts about U.S. inequality, providing a clear and concise overview of the current state of disparities in the country. These facts aim to inform, challenge perceptions, and encourage dialogue towards change. Whether you’re deeply invested in social issues or simply looking to understand more about American society, these insights offer valuable perspectives on the inequality that shapes the lives of millions.
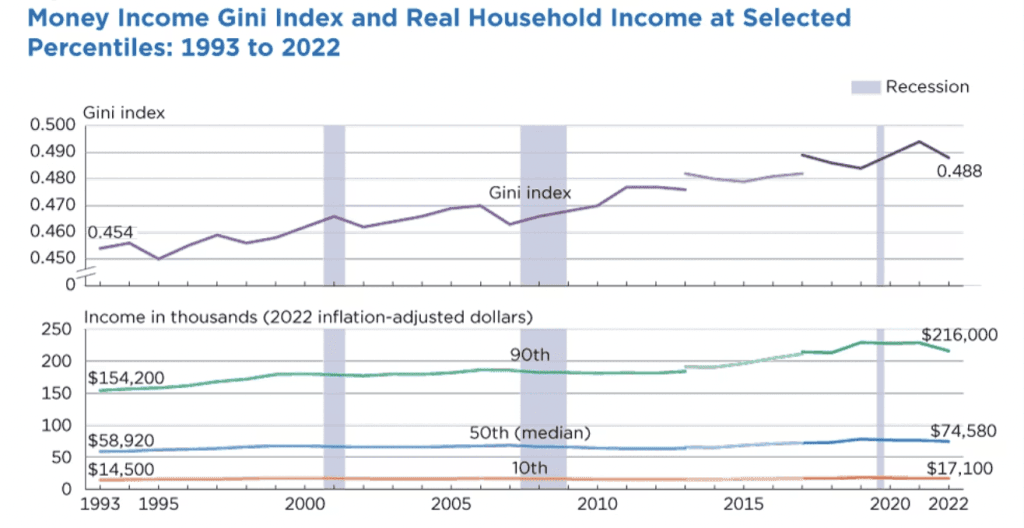
The Gini Index measures the extent to which the distribution of income among individuals or households within an economy deviates from a perfectly equal distribution. The Gini Index has slowly increased since 1993, raising from 0.454 to 0.488 in 2022. This reflects significant increases in Real Household Income at the 90th and 50th percentiles, while income at the 10th percentile has remained more stagnant.
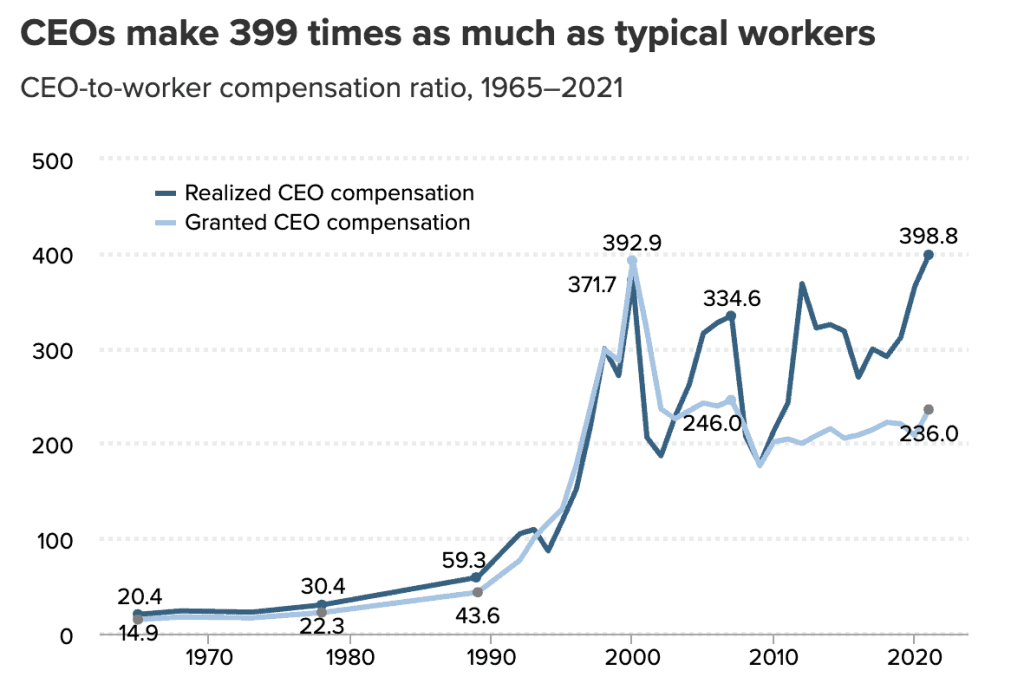
Realized CEO compensation is a measure of CEO Pay that includes the value of stock options when they are finally exercised, and Granted CEO compensation includes the value of stock options when they are acquired by the CEOs. Realized CEO compensation reached an all-time high in 2020, with the CEO-to-worker compensation ratio reaching 398.8-to-1.
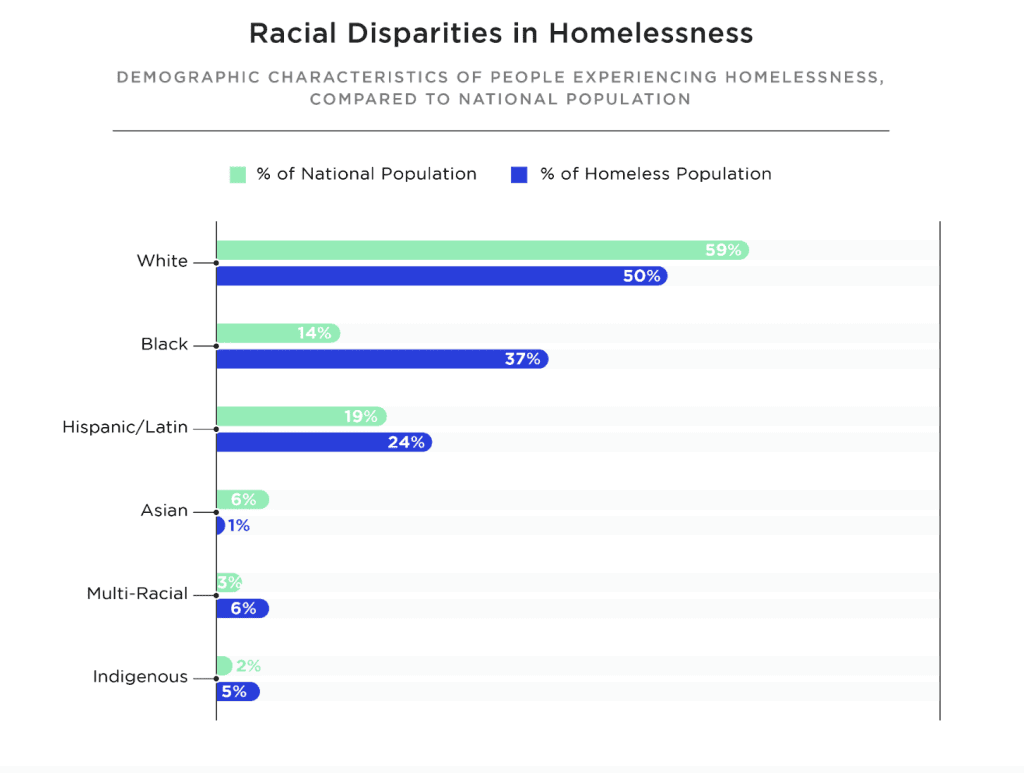
White and Asian demographics are underrepresented in homeless populations as of 2022, while Black, Hispanic/Latin, Multi-Racial, and Indigenous demographics are overrepresented in the homeless population when compared to the national population.
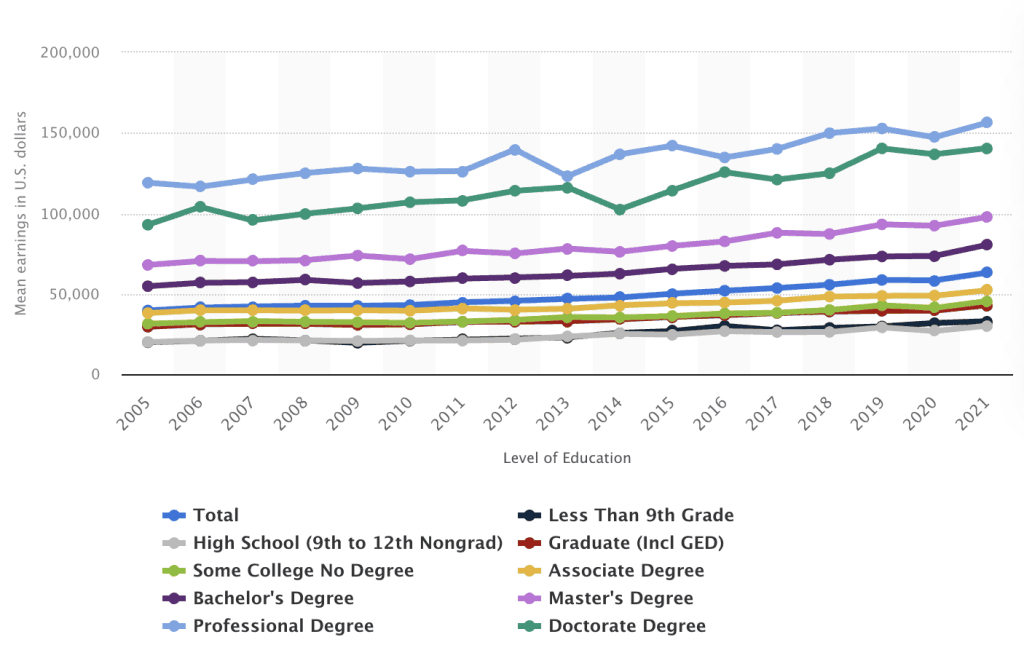
Mean earnings have increased in recent years for people at all educational attainment levels. However, mean earnings for those with Professional degrees and Doctorate degrees have seen disproportionate increases since 2014 when compared to other attainment levels.
Mean earnings in the United States from 2005 to 2021, by level of educational attainment
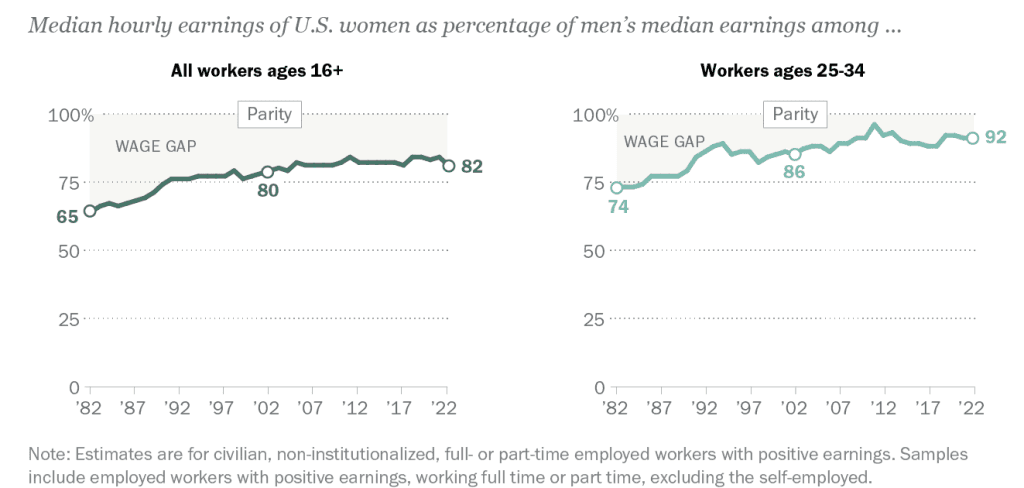
The Gender Pay Gap has stayed reasonably stable since 2002, with a small increase in median hourly earnings of U.S. women as a percentage of men’s earnings from 80% to 82% for all workers. However, the Gender Pay Gap is closing for workers ages 25-34, which has gone from 86% in 2002 to 92% in 2022.
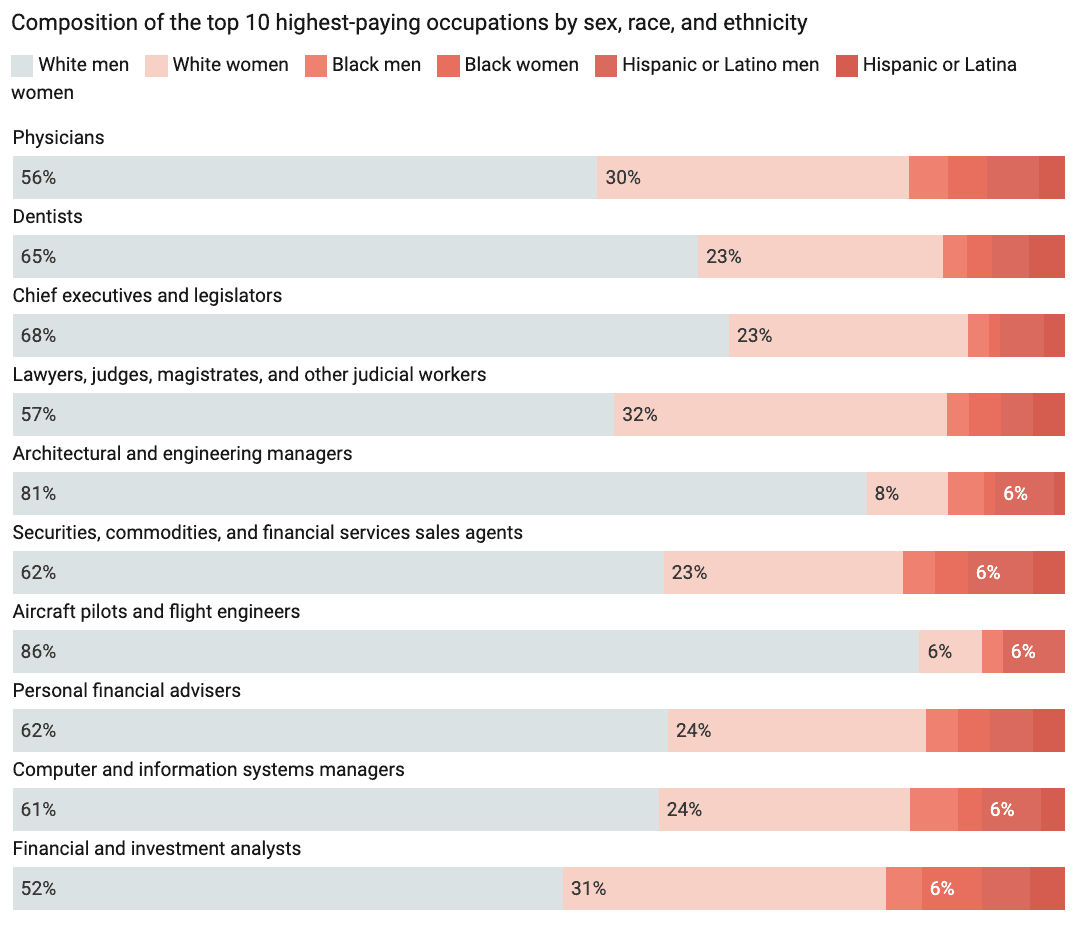
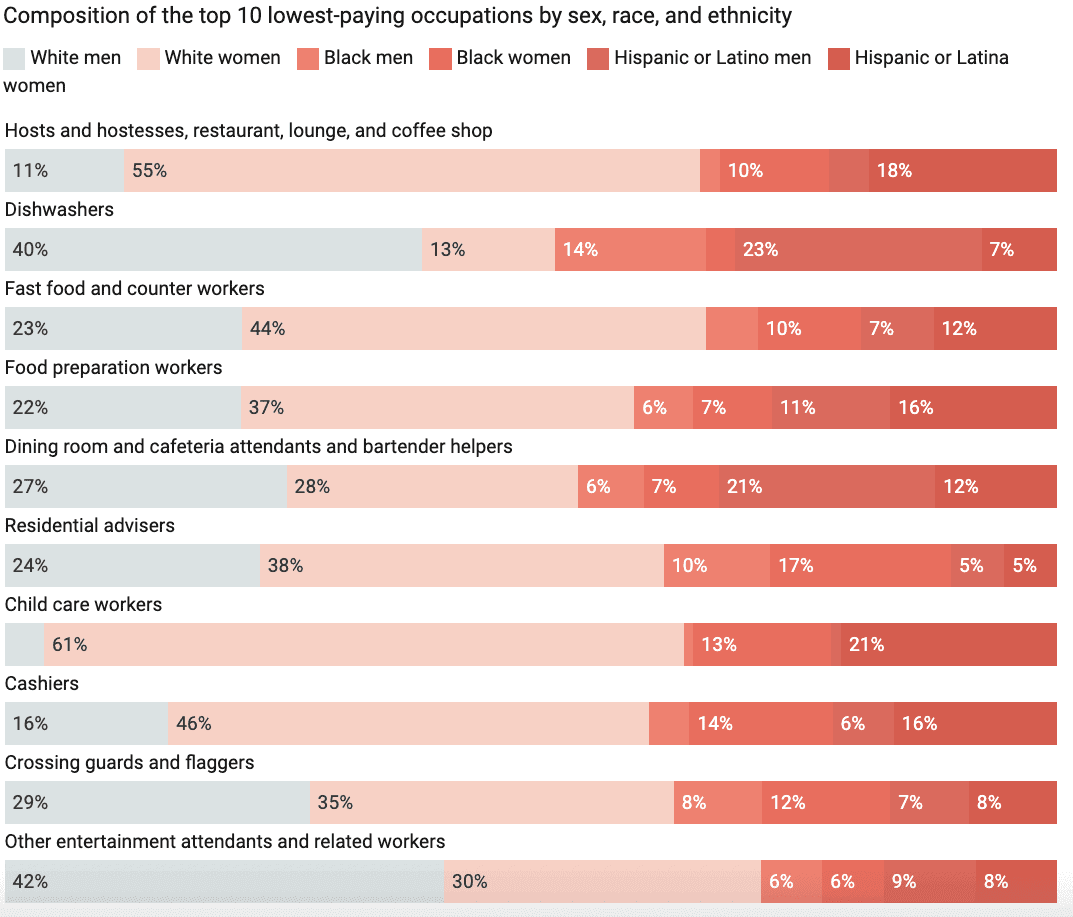
White men were overrepresented in the top 10 highest paid occupations in the U.S., while men of color and women were overrepresented in the top 10 lowest paying occupations as of 2019.
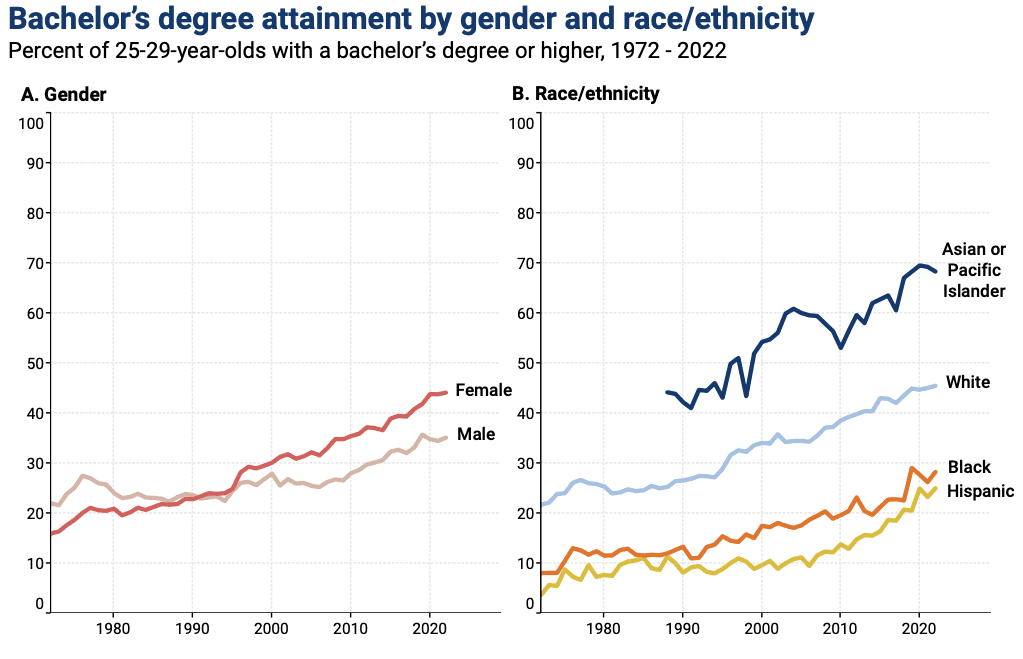
Bachelor’s degree attainment in the U.S. has increased overall from 1972-2022. However, females have a significantly higher Bachelor’s degree attainment rate than males as of 2022. This gap widened in the 2000s, and has remained relatively stable since. Also, Asian/Pacific Islander populations have the highest degree attainment rate, followed by white, black, and hispanic populations. This order of degree attainment rate has not changed since 1972.
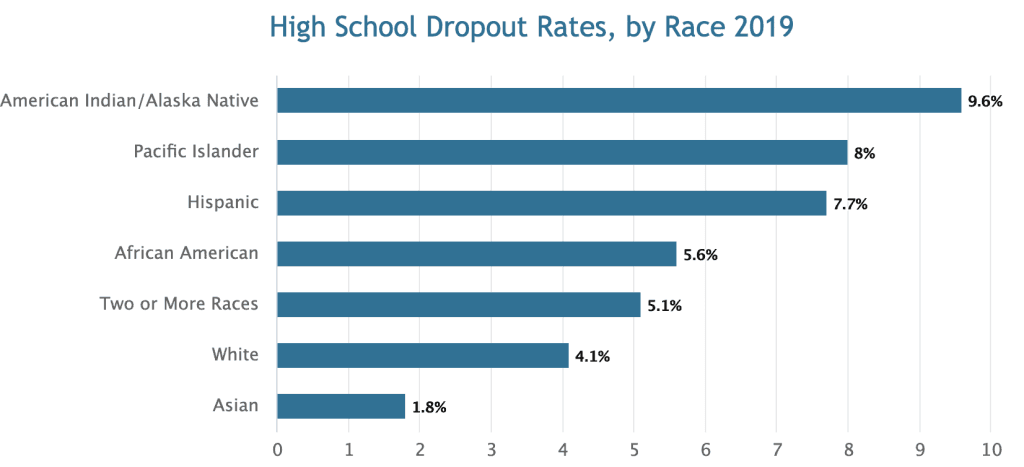
American Indian/Alaska Native populations have the highest high school dropout rate as of 2019. Pacific Islander, Hispanic, African American, and Two or More Races populations all have dropout rates above 5%. White and Asian populations have dropout rates of 4.1% and 1.8%, respectively.
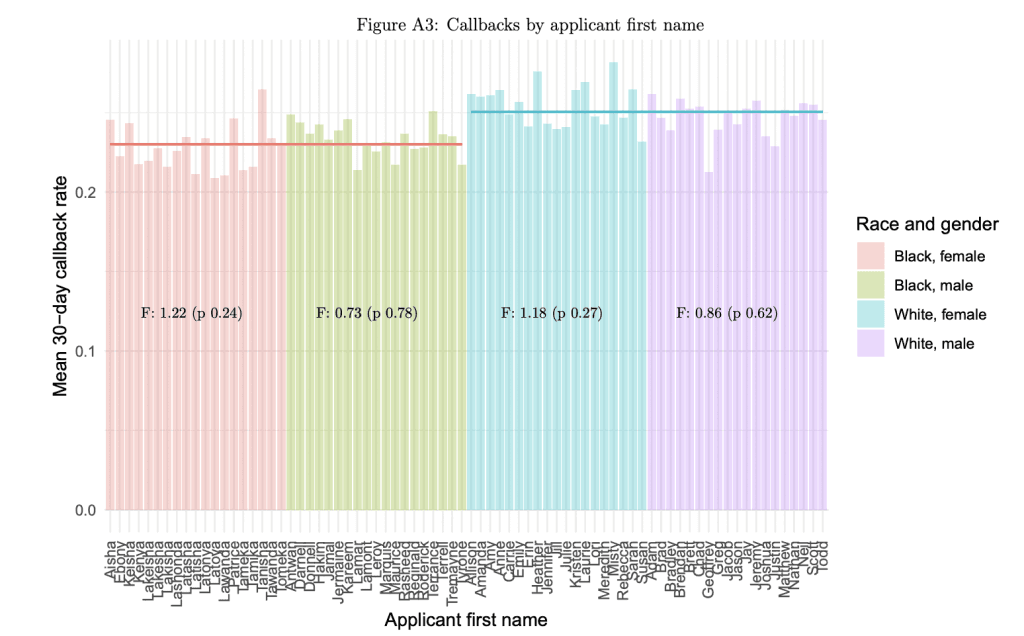
Racial discrimination continues to persist in the labor market in 2022. In a 2021 study, researchers found disparities between the callback rate for white versus black applicants by applicant first name, as well as male vs female applicants.
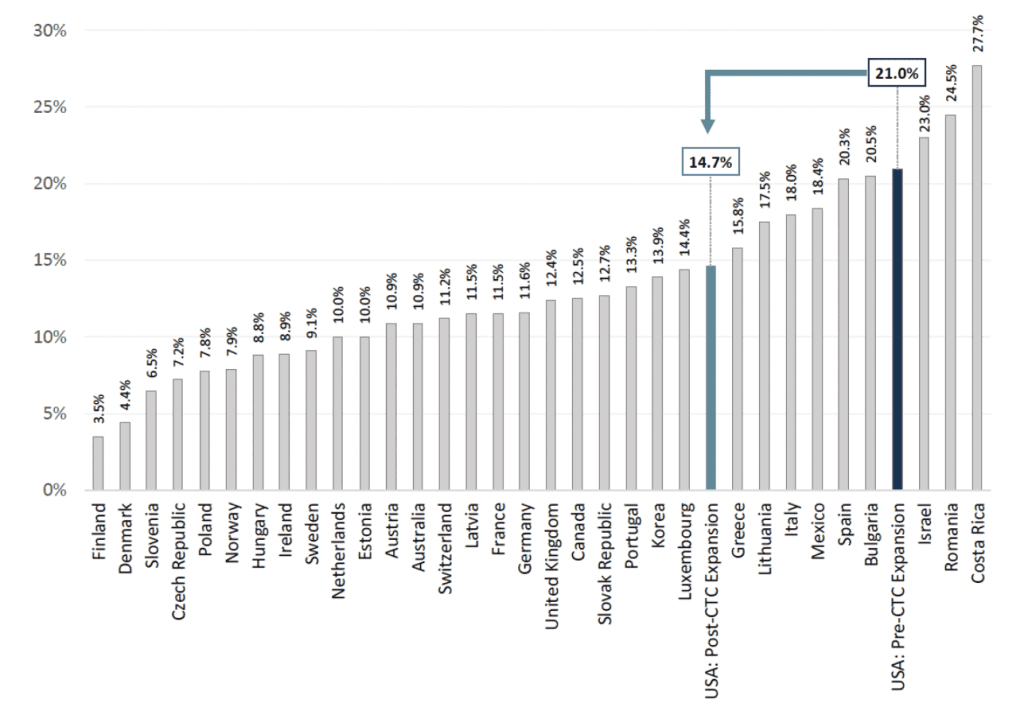
Accounting for child tax credit expansions in 2018 significantly decreased the child poverty rate in the U.S. from 21.0% to 14.7%. However, this still placed the U.S. significantly higher than Germany, the United Kingdom, France, Sweden, Denmark, Norway, and several other rich countries.
International Child Poverty Rates Before and After Accounting for Potential Child Tax Credit Expansions in The United States
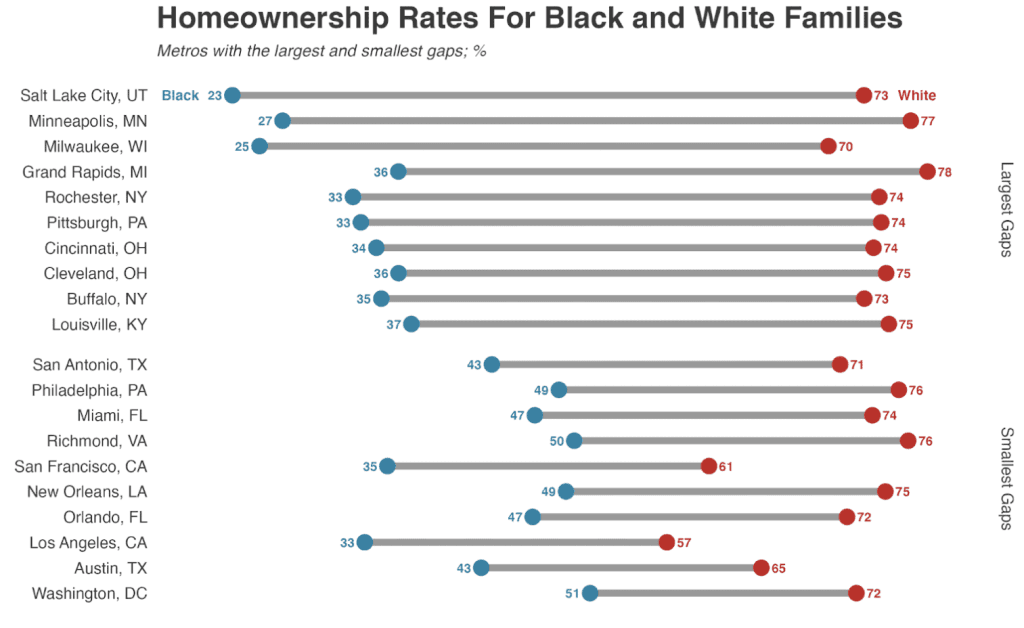
Even in the metropolitan areas with the smallest disparities, White Families are significantly more likely to own their home than Black Families.
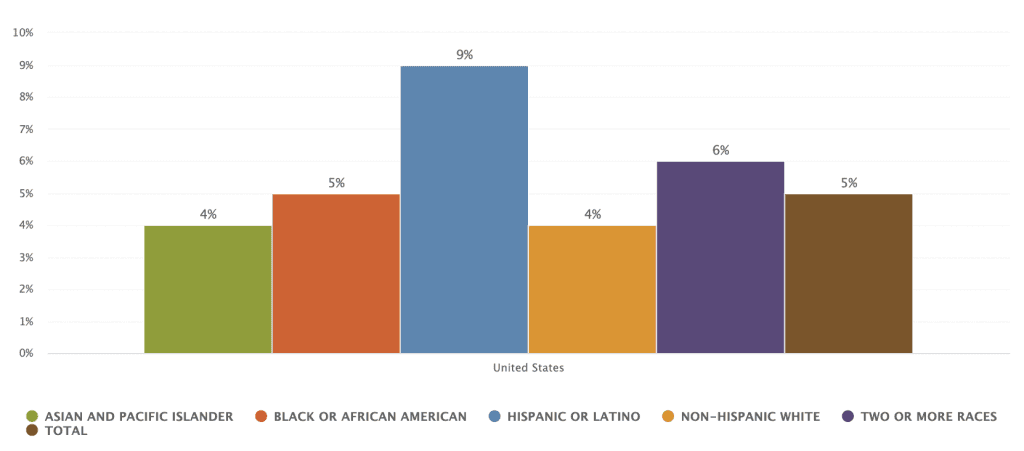
Hispanic children and children identifying with Two or more Races have disproportionately high rates of lacking health insurance coverage, while White and Asian/Pacific Islander children have disproportionately low rates of lacking health insurance coverage, as of 2021.
Children Without Health Insurance by Race and Ethnicity in The United States
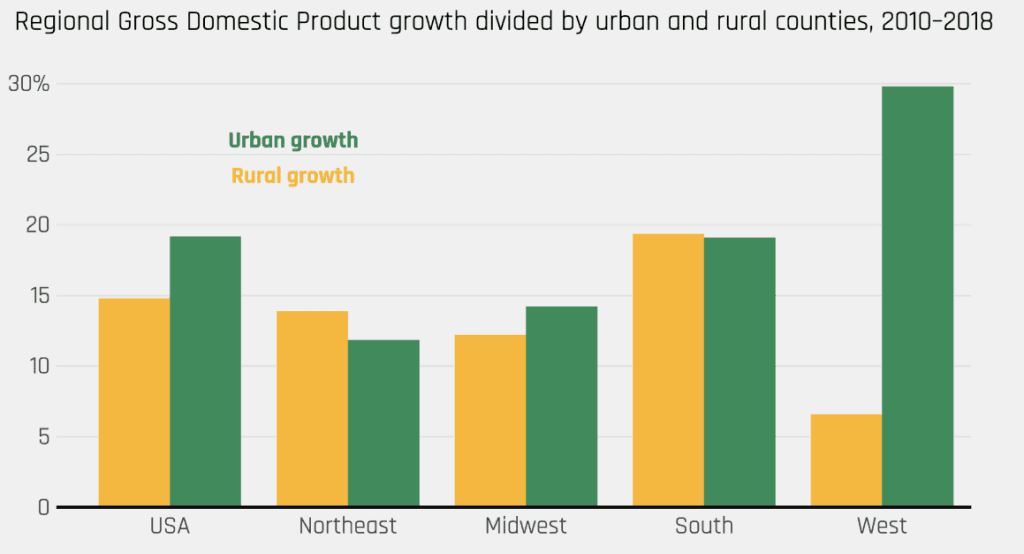
There were regional disparities in Urban vs Rural growth in GDP from 2010-2018. Overall, Urban growth was higher than Rural growth. However, Urban and Rural growth was comparable in the Northeast, Midwest, and South, but Urban growth was incredibly high in the West when compared to Rural growth.
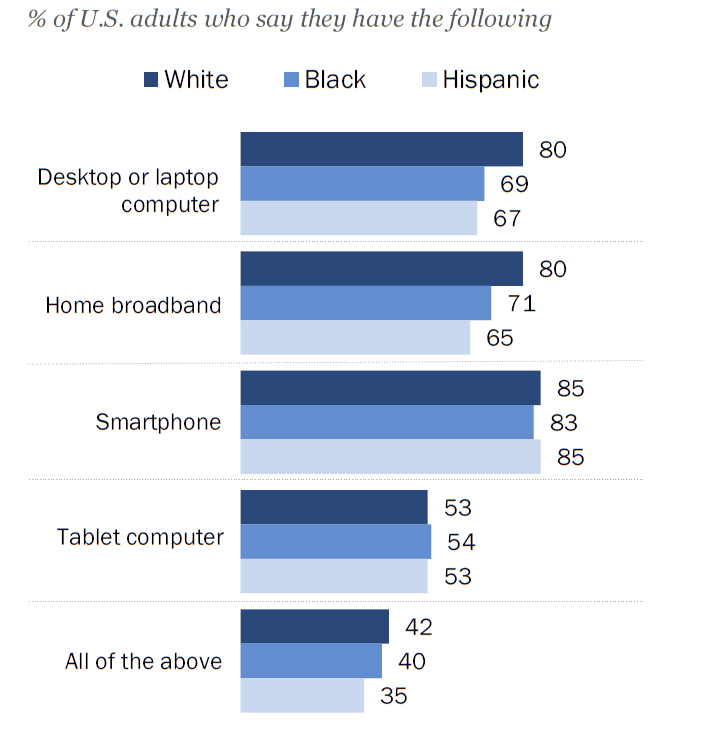
Black and Hispanic adult populations are significantly less likely to have a traditional computer and home broadband connection than White adult populations.
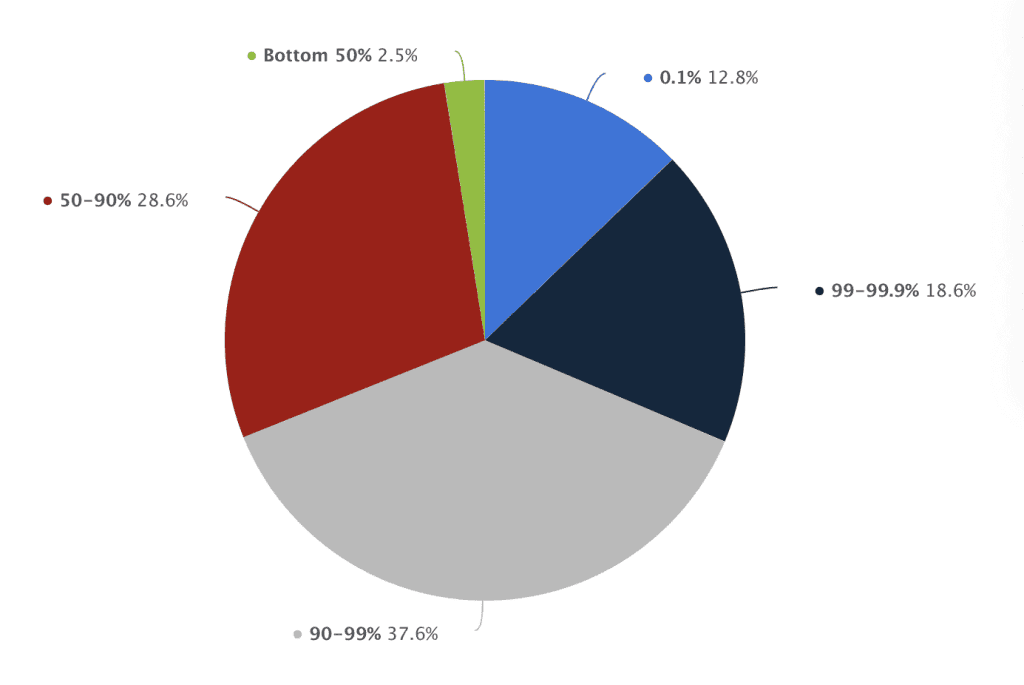
In the second quarter of 2023, 69 percent of the total wealth in the United States was owned by the top 10 percent of earners. In comparison, the lowest 50 percent of earners only owned 2.5 percent of the total wealth.
Wealth distribution in the United States in the second quarter of 2023
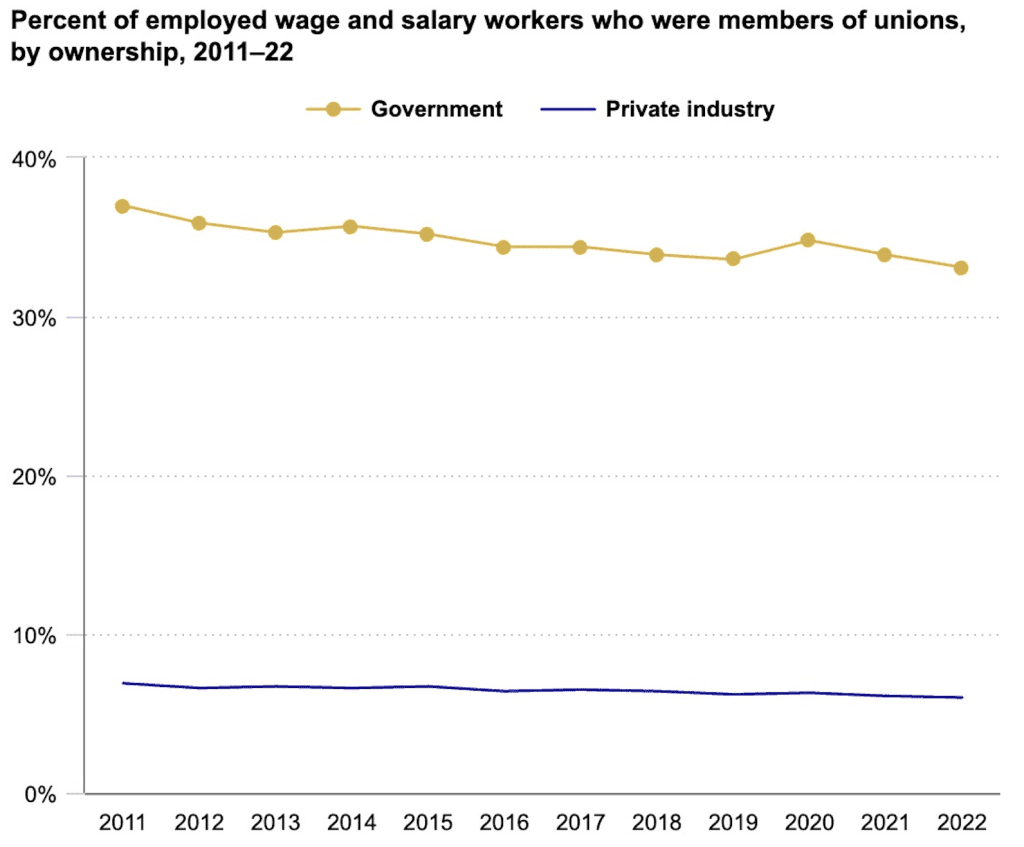
The percent of government-employed wage and salary workers who were members of unions has been consistently decreasing since 2011. However, this rate, over 30%, is still significantly higher than for wage and salary workers in private industry, who have had a relatively stable rate of under 10% since 2011.
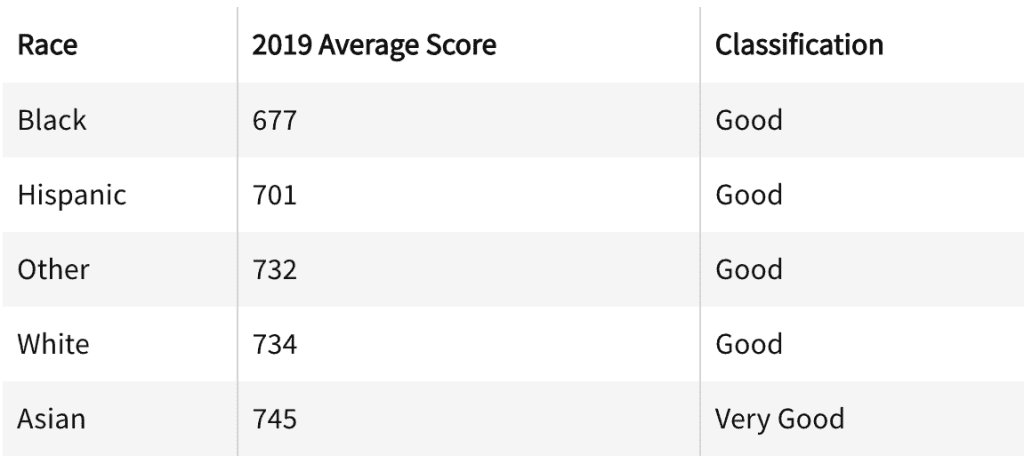
Credit scores are extremely important for the acquisition of home or business loans, as well as loans for other significant purchases. Asian and White demographics had the highest mean credit scores as of 2021, with Hispanic and Black demographics having the lowest mean credit scores.
Average FICO Score by Race
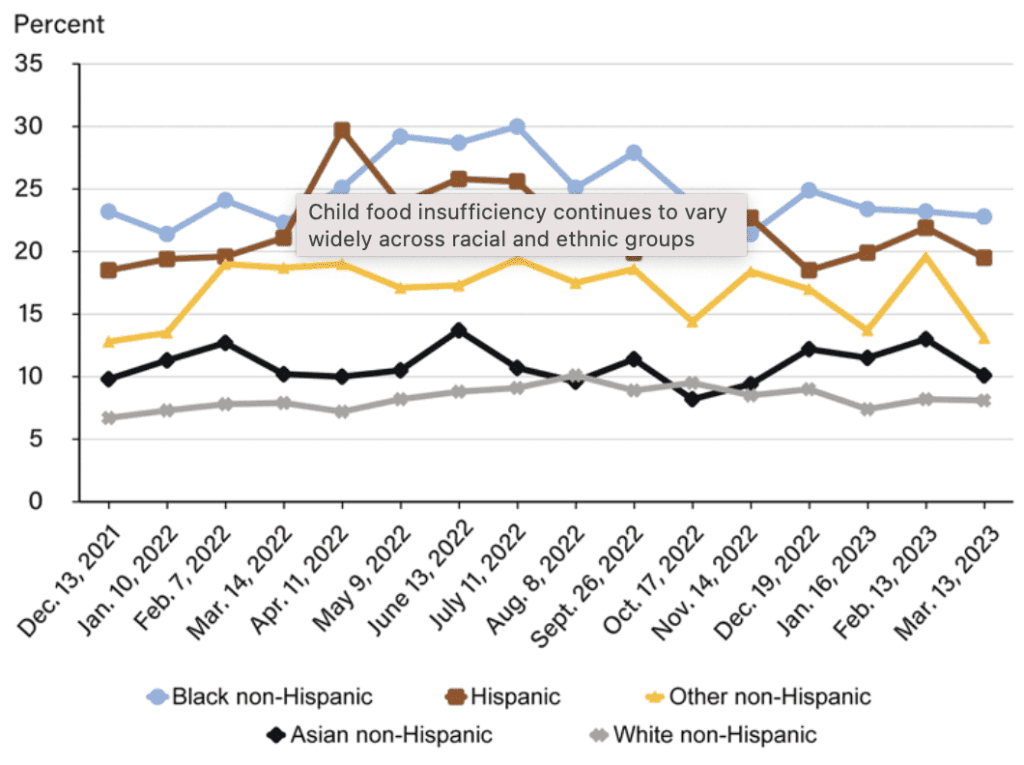
As of 2023, Black and Hispanic populations have the highest rates of child food insufficiency among households with children, while White and Asian populations have the lowest food insufficiency rates. Food insufficiency is defined here as a household not having enough food to eat either sometimes or often in the past 7 days.
Child Food Insufficiency Rates Among Households with Children by Racial and Ethnic Group
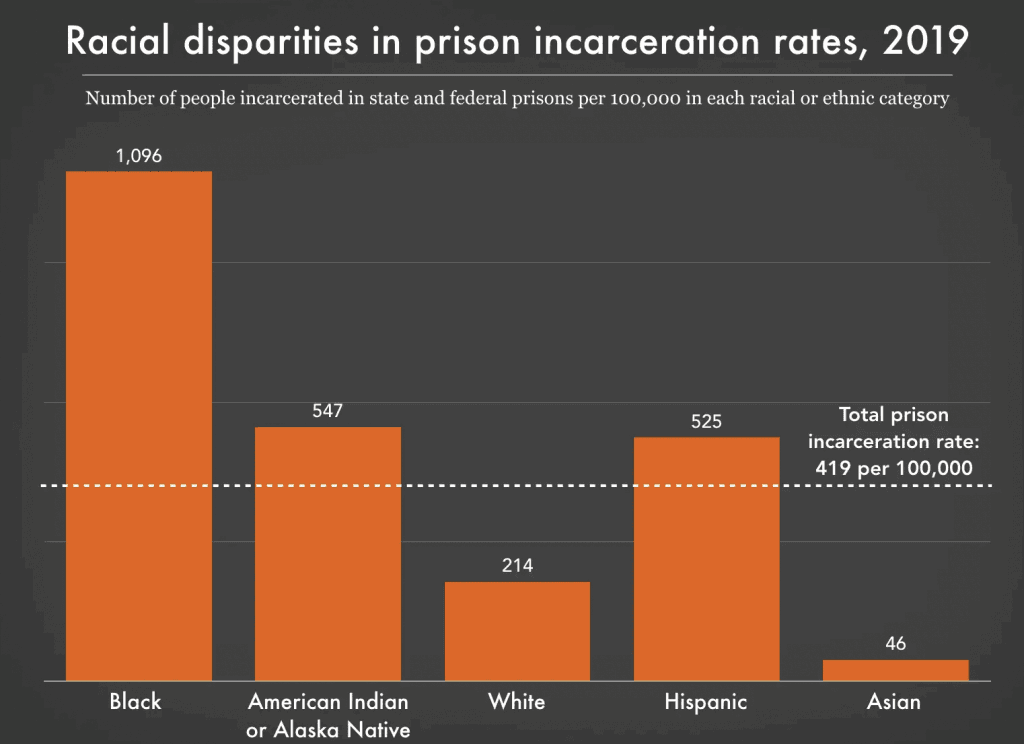
As of 2019, black populations are significantly overrepresented in prisons, with the highest number of people incarcerated in state and federal prisons at 1,096 per 100,000. American Indian or Alaska Native and Hispanic populations are also overrepresented in prisons, while White and Asian populations are significantly underrepresented.
In reflecting upon the many facets of inequality in the United States, it is evident that change is both imperative and possible. This compilation of 20 critical facts serves not just as a documentation of the current disparities plaguing American society, but also as a catalyst for awareness, discussion, and action. Recognizing these issues is the first step towards forging a more equitable nation, and each of us holds the power to contribute to this process. From local community initiatives to nationwide policies, people at all levels of the political and economic system have opportunities to do their part. By staying informed, challenging the status quo, and being active in our respective spheres of influence, we can chip away at the structures of inequality together.